
Introduction
This article describes an approach for using Ghidra to perform malicious code analysis. Ghidra is a free software reverse engineering (SRE) framework developed by the National Security Agency (NSA) of the United States. It was released as open-source software in March 2019, making this powerful reverse engineering tool available to all, regardless of budget.
Developers at the NSA maintain an active GitHub page for Ghidra where they have addressed hundreds of bugs, questions, and enhancement requests. Since its release, Ghidra has attracted a growing community of contributors and has seen four minor releases. We touched on the release of Ghidra and mentioned its key features in a previous blog.
Analyze a File with Ghidra
Loading an Executable
The latest Ghidra release is available here. Installing it is as simple as downloading and extracting the zip archive. To begin, launch the Ghidra batch file. Then, create a project via selecting File >> New Project. Since reverse engineering efforts often target multi-component malware samples, Ghidra wisely focuses on projects instead of individual files.
Project options include “Non-Shared” for single-user analysis and “Shared” for collaborative work, where multiple users can access a project repository on a server. This blog post focuses on single-user analysis, but the alternative is an important feature and worth exploring for team reverse engineering efforts. After selecting the project option, it is time to give it a name:
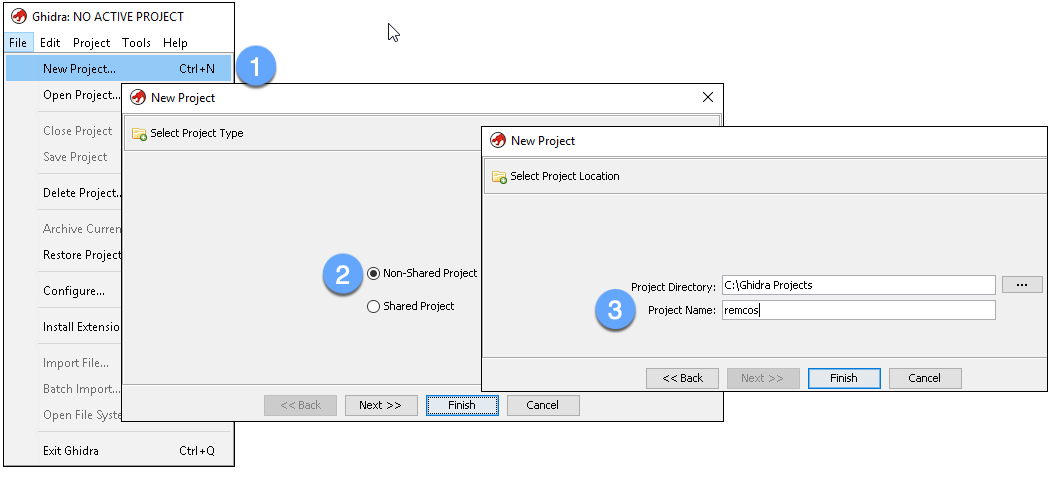
Figure 1: Create a new project
Our example focuses on the analysis of a Remcos sample. Remcos is a remote administration tool (RAT) sold by Breaking-Security.net. As a RAT, it can monitor and control infected machines in numerous ways.
Next, drag and drop your file sample into the project window. This will launch a dialog box where you can accept the defaults. Click “OK” to proceed:
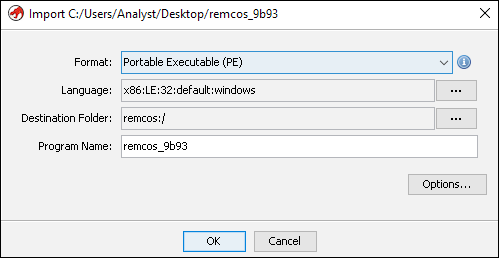
Figure 2: Import a file
Summary information appears once the import is complete:
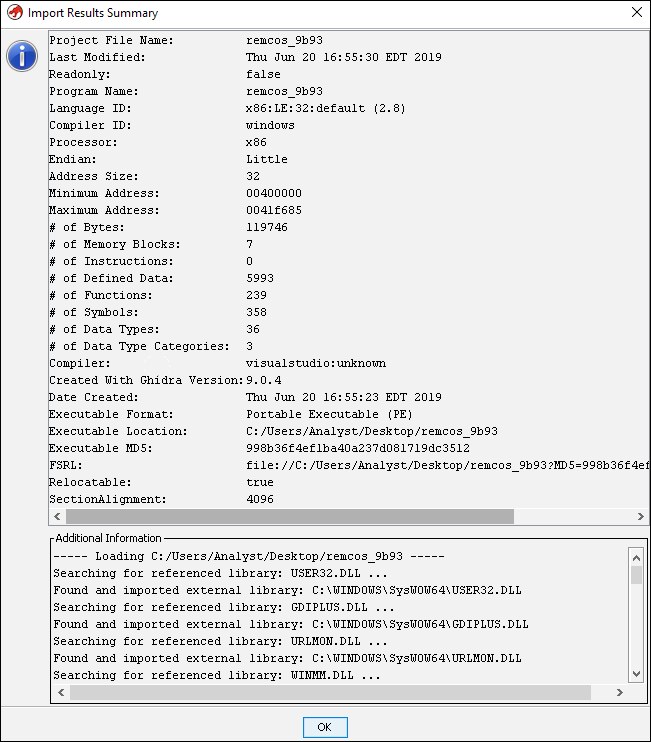
Figure 3: Import results summary
Double-clicking the imported file within the project window launches the CodeBrowser with a prompt to analyze the file. This is a good time to modify the analysis options to include “WindowsPE x86 Propagate External Parameters.” This option will populate function arguments in the comments. Next, click the “Analyze” button:
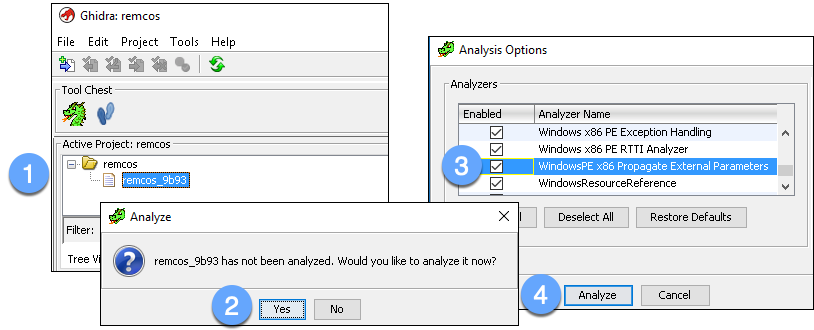
Figure 4: Initiate file analysis
Modify Display Elements
You can now use the CodeBrowser to review the target file while Ghidra performs analysis in the background. It may be beneficial to make some changes to the Listing window (where the assembly code is displayed) to enhance readability. To access CodeBrowser options, select Edit >> Tool Options:
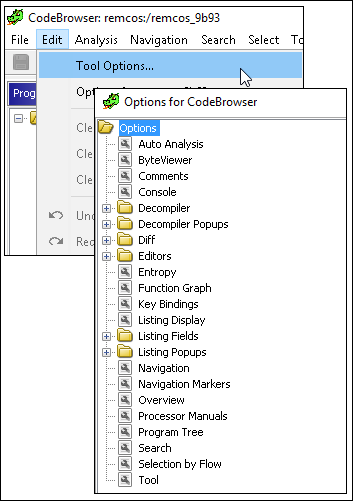
Figure 5: View CodeBrowser options
Below are some suggested environment changes (ones used for the screenshots in this article):
- Listing Display: Increase the font size and enable bold formatting for easier reading
- Listing Fields >> Bytes Field: Change “Maximum Lines to Display” to 1 to simplify spacing between lines of assembly code
- Listing Fields >> Cursor Text Highlight: Change “Mouse Button to Activate” to LEFT. This will highlight all instances of the selected text when the left mouse button is clicked (similar to other disassemblers)
- Listing Fields >> EOL Comments Field: Check “Show Semicolon at Start of Each Line” to better separate the assembly text from inserted comments
- Listing Fields >> Operands Field: Check “Add Space After Separator” for improved text readability
Investigate an API Reference
It is a common practice to identify interesting code based on Windows API references. There are multiple approaches to viewing API references within Ghidra’s interface. Here, we will view references via Window >> Symbol References (note that this list includes more than Imports).
Select an API of interest and identify where that function is called. For example, the CreateProcessA API is worth investigating to understand what additional processes this program spawns. To locate a reference to this API simply click on the API name and choose a reference on the right-hand side. Below, we click on the second reference to CreateProcessA:
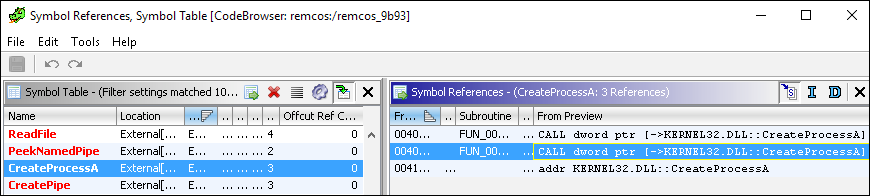
Figure 6: Identify CreateProcessA API references
Clicking a reference populates the Listing view with the appropriate disassembly:
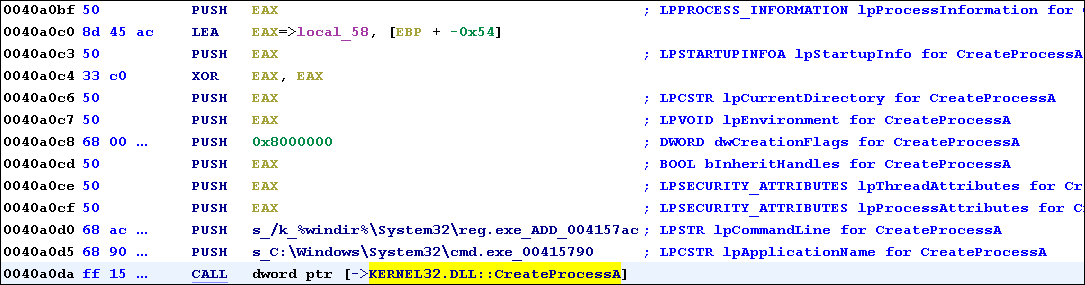
Figure 7: Follow a CreateProcessA API reference
At virtual address 0x40A0DA we see the CALL to CreateProcessA. The PUSH instructions above the CALL refer to CreateProcessA’s arguments. On the right, we see autogenerated comments that identify the function parameters (as described on Microsoft’s website). The dwCreationFlags parameter specifies the process creation flags, which are characteristics of the spawned process. A complete list of flags can be found here.
The value 0x8000000 represents a symbolic constant. We can convert this to a more human-readable representation by right-clicking the value and selecting “Set Equate…”. The resulting window displays multiple options for the chosen hexadecimal value. To identify the correct choice for this API, notice that most of the process creation flag options on Microsoft’s website began with “CREATE_”. Typing this into the “Equate String” field yields only one option: CREATE_NO_WINDOW. This flag specifies that the spawned process should not launch a console window and is likely the correct choice. Select this value and press OK:
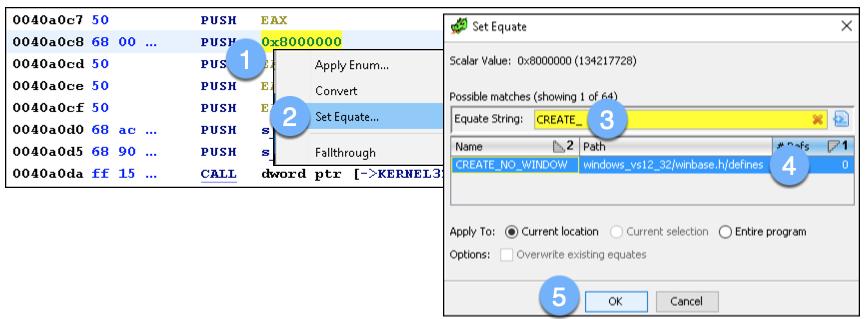
Figure 8: Converting the hexadecimal value to symbolic constant
The assembly now displays the text representation of the creation flag instead of the hexadecimal value:
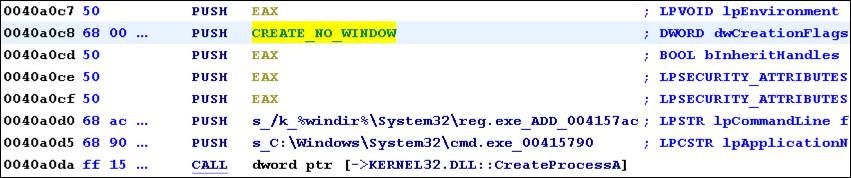
Figure 9: View text representation of creation flag
View Decompiler Output
One incredibly helpful feature of Ghidra is the built-in decompiler output. It displays the high-level C representation of the assembly code. Highlight the call to CreateProcessA to drive the Decompile window (located to the right). While the code in Figure 9 is decipherable to an analyst familiar with assembly, the decompiler output in Figure 10 clearly accelerates analysis of this function call.
Note that the decompiler output stays in sync with changes made within the Listing view. This explains why CREATE_NO_WINDOW appears as an argument to CreateProcessA in the C representation. Similarly, any changes made to the function, variable, or argument names in either the Listing or Decompile view will update the other window.
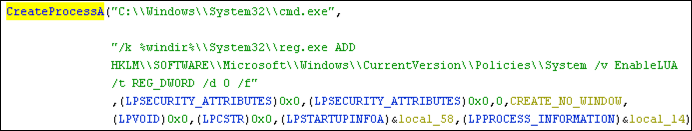
Figure 10: Decompile call to CreateProcessA API
By briefly reviewing this code, we discover it attempts to disable User Account Control (UAC) by modifying the EnableLUA value in registry key HKEY_LOCAL_MACHINE\SOFTWARE\Microsoft\Windows\CurrentVersion\Policies\System.
Investigate a String Reference
Another approach to identifying malicious code involves following references to suspicious strings. To review strings embedded within a target file we navigate to Window >> Defined Strings. Since this sample is feature rich and not obfuscated there are many strings worth investigating. For example, we find “[Following text has been copied to clipboard]” (Figure 11). Is this an indication that the malware copies clipboard text as part of its surveillance activities? Let’s confirm by browsing to a reference to this string within the code.
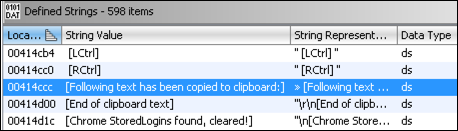
Figure 11: View strings
Clicking on the row associated with this string populates the Listing window with the data at address 0x414CCC. To identify references to this string we right-click in the blue area >> References >> Show References to Address:
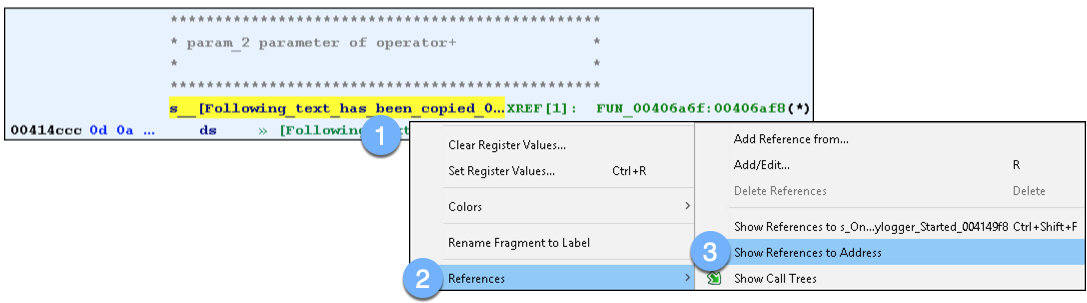
Figure 12: Finding references to a string
The resulting window shows only one reference to this string:
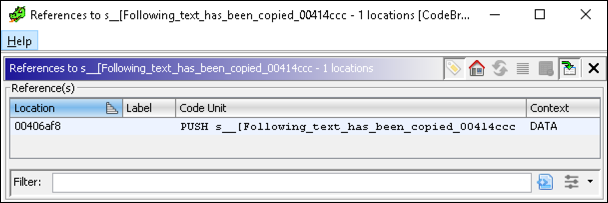
Figure 13: View string references
Clicking on this single reference takes us to 0x406AF8, located in the function with label FUN_00406a6f. Scrolling up and down, it is not immediately clear what code, if any, might be responsible for capturing clipboard data. Rather than manually digging into each function called we can access the Window >> Function Call Graph. The function call graph displays the relationships between functions and provides a high-level overview of function calls. By navigating this interface we discover that the call to FUN_00406a29 executes Windows APIs that allow the malware to collect clipboard data. Specifically, it executes OpenClipboard, GetClipboardData, and CloseClipboard:
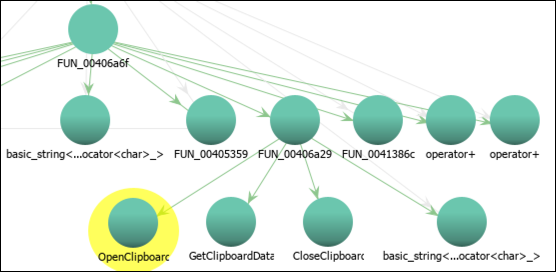
Figure 14: View Function Call Graph
To dive into the function FUN_00406a29, click on the function label with that name and view the Listing or Decompile windows. Alternatively, click on the Listing or Decompile view, press the “g” key, type the function label name or address, then click “OK” to jump to the code. In addition to simply reviewing the disassembly text, it is often beneficial to see a visual representation of decision points within a function. Navigate to Window >> Function Graph to view the function’s individual code blocks and the arrows representing conditional and unconditional jumps:
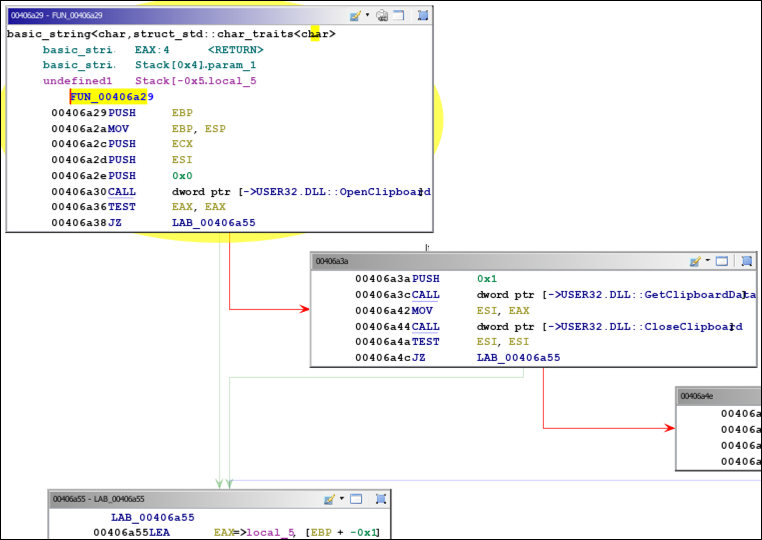
Figure 15: View Function Graph
In the first code block we see a call to OpenClipboard followed by TEST and JZ (jump if zero) instructions. These evaluate the return value stored in EAX. The JZ instruction indicates that execution should jump to 0x406A55 if EAX is zero. A return value of zero means the call to OpenClipboard failed. If EAX is non-zero the call to OpenClipboard succeeded. In this case, the jump will not be taken. Execution will flow to the code block on the right, where additional API calls are made to obtain clipboard data. In other words, if the clipboard opened successfully, obtain its data; otherwise do not execute code to gather clipboard information. Notice that execution follows the green arrow if the condition (EAX is zero) is true, and execution follows the red arrow if the condition is false.
Scripting
Ghidra includes support for writing Java and Python (via Jython) scripts to automate analysis. To view built-in scripts, go to Window >> Script Manager. There are over 200 scripts included with many more available online.
As an example, we will write a simple Python script to print all CALL instructions within a specific function. To create this script, choose “Create New Script” from the top-right of the Script Manager. Select Python for the script type and give the script a name:
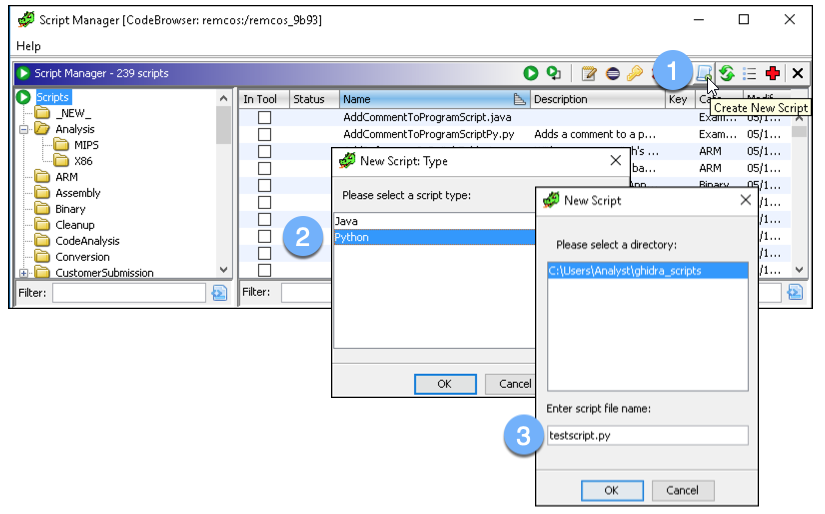
Figure 16: Choose to create a Python script
Within the script editor, we can add the following:
#description: Print all CALLs within a function.
#@author: Analyst
#@category _NEW_
fn = getFunctionAt(currentAddress)
i = getInstructionAt(currentAddress)
while getFunctionContaining(i.getAddress()) == fn:
nem = i.getMnemonicString()
if nem == "CALL":
target_address = i.getOpObjects(0)[0]
print(nem + " " + str(getSymbolAt(target_address)))
i = i.getNext()
As with any script, there are various ways to accomplish the same objective. Our example provides a glimpse of how functions, instructions, and operands are accessed via a Python script.
To test the script we will run it from the function that called the clipboard APIs. This is done by performing the following actions:
- Jump to 0x00406A29 via the “g” key within the Listing window
- Switch back to the Script Manager
- Double-click the new script
The Console window should appear with output showing the calls to clipboard APIs:
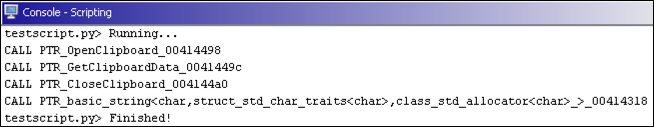
Figure 17: Running the test script
Closing Thoughts
Ghidra’s release brings powerful reverse engineering capabilities to the masses at no cost. If you are just getting started with malware analysis, it is an excellent tool to explore for reverse engineering. If you are a seasoned analyst, exposure to this alternative framework may be eye-opening. In the best case, you discover a new tool and methods for expanding your RE arsenal. In the worst case, you find even more reasons to love your current tool of choice.
To learn more about Ghidra, read the training material included in the official zip file. On Twitter, search #Ghidra for other helpful resources, including the official Ghidra Twitter account @GHIDRA_RE (note: this account is not associated with the NSA). The Ghidra Github issues page is also an excellent resource.
For similar articles and news delivered straight to your inbox, subscribe to the BlackBerry blog.