Kaggle is a world-famous platform of machine learning competitions where companies and research institutes challenge Data Scientists around the world on predictive analytics problems with their dataset.
In each competition, the host provides the dataset and a description of the problem they want to solve and the evaluation metric. Participants will then submit their prediction on the test set. Scoring for a part of the test set is then displayed on the “public leaderboard,” where participants can see their current ranking in the competition.
Scoring for the rest of the test set is invisible to participants until the end of the competition, known as “private leaderboard.” The final rank is then evaluated on the private leaderboard to prevent participants from probing and overfitting so the final top solutions can generalize well. This is done to prevent any Data Scientist from “gaming the system” in order to win with a model unable to predict from unknown data but just memorize the known data.
Introducing Kaggle
People are always amazed by how professional athletes outperform normal people in their sports. Kaggle turns machine learning into a sport. There are now over one million users on Kaggle and, on average, thousands of participants in each competition. Fierce competition pushes participants to explore more in machine learning and jump out of their knowledge comfort zone.
Even very experienced Data Scientists would be surprised about how the machine learning solution is significantly improved during the competition. Top ranking Data Scientists on Kaggle, Kaggle Masters and Grandmasters, as they are called, who survived at top positions on leaderboard after several competitions, are well recognized by the applied machine learning community.
Typically, these Data Scientists are proficient in:
- Fast prototyping on new problems, even without prior domain expertise
- Strong willpower of trying new ideas and never give up when something not working out
- Major popular open-sourced machine learning libraries. Being able to build their own tools for efficient model building
- Innovative feature engineering and modeling
Cylance Data Scientist, Li Li, participated the “Facebook V: Predicting Check Ins” competition and finished fifth out of 1212 competitive Data Scientists. In this article, we share Li’s insights on the problem presented to contestants. The full code is available open-sourced on Github.
The Competition:
The goal of this competition was to predict which business a user is checking into, based on their location (x and y), accuracy, and timestamp. Facebook created an artificial world consisting of more than 100,000 places located in a 10km by 10km square. The training data contains users’ check in places in the past time-period and the test set is in the future time.
A good machine learning model that is robust to noisy and inaccurate data can largely improve the experience of mobile services like Facebook check in. The evaluation metric is mean average precision @ 3 (map3).
For each check in, the participant can predict 3 places. If the first/second/third prediction hit the real check in place, you will get 1/0.5/0.33 for this check in. The final score averages over all the samples.
Validation Set:
The size of the data set is very large. In order to use time efficiently, the model and hyperparameter selection are done on 1/100 of the total data set. It is data in range 5 < x < 6, 5 < y < 6. Then the last 171360 minutes are used as validation set. By using this subset, the performance of one model can be known within 20 minutes.
According to the admin, the real test set has removed unseen place_id. But it is not removed in validation set in this solution. So the local map3 score will be lower than public leaderboard.
Strategy of Hyperparameter Selections
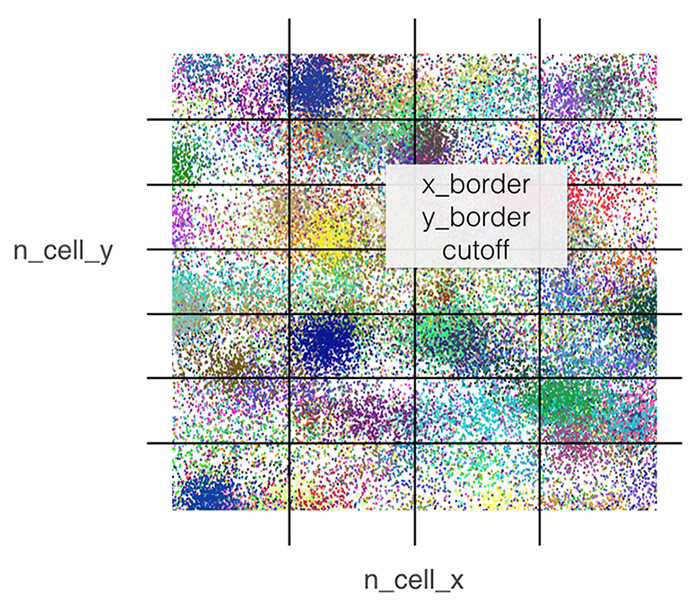
- n_cell_x, int number of cells divided in x for test and validation set
- n_cell_y, int number of cells divided in y for test and validation set
- x_border, float border on the edge of the cell for larger range of training set
- y_border, float border on the edge of the cell for larger range of training set
- th, int cutoff low frequency labels
Those parameters as well as parameters of different models are considered as the hyperparameters.

Figure 1
Li wrote his own random grid search code to find the optimal hyperparameters of each classifier. This code will append all the hyperparameters and corresponding local validation score to a record file. It also guarantees new generated hyperparameters will not duplicate with previous one in record. Thus, the range and density of each hyperparameters can be easily adjusted in the selection process.
Ensemble
Each single model will predict top 10 place_id with probabilities for each row_id. They are stored in csv as (row_id, place_id, proba). This output file for a validation set is about 3.3Mb and 351Mb for test set. The probabilities of different models are ensembled with python defaultdict and output the top 3 place_id as prediction.
Li first ensembled the validation set to see which combination of the models had better performance. Then, an ensemble on the whole data set will be run with this combination.
The idea of finding the combination is:
- Try to increase the diversity of the model. This includes different number of cells and different models.
- Then list model candidates in different category and sorted them by local map3 score.
- Do greedy search to find the combination with highest local validation score.
- The final submission is an unweighted sum of single models. Li also tried to find weight by bayes optimization. There is some improvement on the 5th digit so this method is ignored in the final submission.
- Then run the ensemble on the whole dataset.
Models in Ensemble
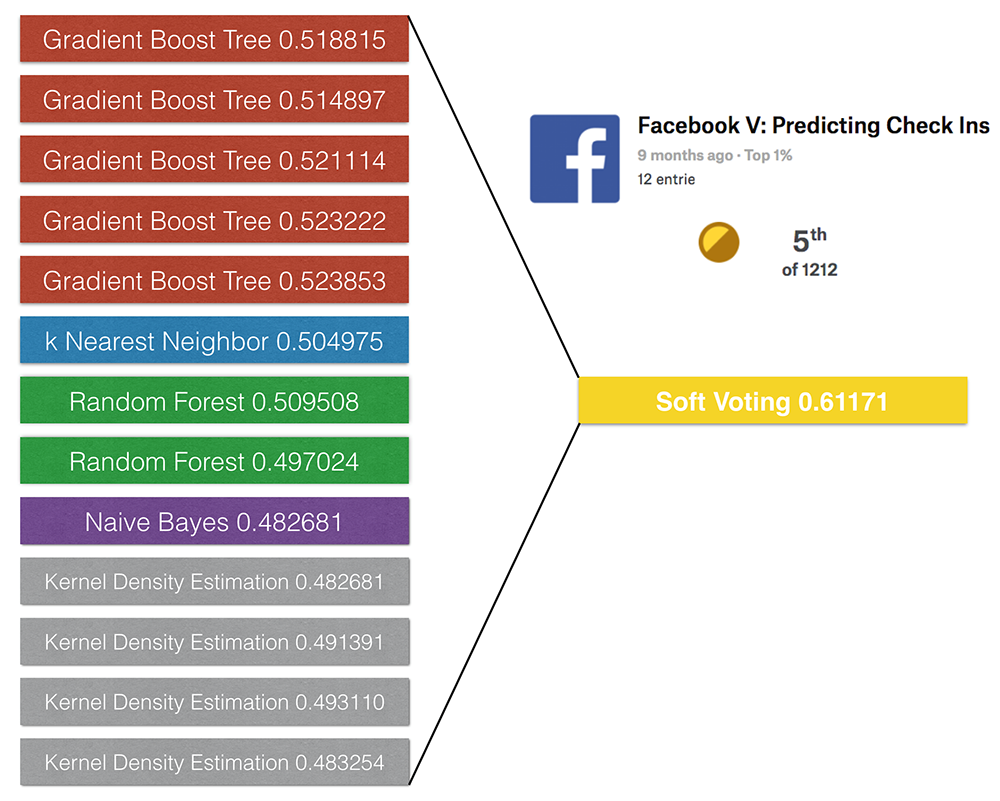
Li’s final submission is a soft-voting of 13 single models, including k-nearest neighbors, random forest, extra-trees, gradient boosting trees, naive bayes, kernel density estimation.

Figure 2
Insights
The structure of this dataset is very interesting. The best XGBoost model only has max_depth=3, which is unusual in previous competitions. This indicates features are almost independent to each other in this dataset. This can be the reason why the Naive Bayes is only 4% worse than my knn.
Naive Bayes is a first assumption of the data distribution. When using the sklearn.naive_bayes.GaussianNB, it also assumes the distribution of each feature in cell is unimodal. But doing a simple visualization of the x, y for given place_id will tell you that assumption is not very good.
One way to improve the Naive Bayes is to use kernel density estimation (KDE) rather than one single gaussian to get the probability density function. This blog gives a nice explanation of KDE.
The performance of KDE is determined by the kernel and kernel parameters (bandwidth for gaussian kernel). 'sklearn.neighbors.KernelDensity' provides you plenty of kernels to choose.
Li’s own hyperparameter selection code told gaussian and exponential are optimal choice while tophat, linear, cosine works badly. sklearn does not provide rule of thumb estimation of bandwidth, so the bandwidth is selected by cross-validation. He also tried the 'scipy.stats.gaussian_kde' because it provides two common rule of thumb estimations of bandwidth by statistician, "scott" and "silverman". They can give fast estimation but are designed for unimodal distribution.
In order to get better bandwidth estimation, Li also used Daniel B Smith's implement of KDE (https://github.com/Daniel-B-Smith/KDE-for-SciPy). 'KDE-for-SciPy' is based on this paper: Z. I. Botev, J. F. Grotowski, and D. P. Kroese. Kernel density estimation via diffusion. The Annals of Statistics, 38(5):2916-2957, 2010.
This estimation is more time consuming but can give good estimation on multimodal distribution. The final submission includes KDE from all those implements.
Take-Home Notes
Be Efficient and Reliable
In applied machine learning, a winning-guaranteed solution doesn’t exist. Every predictive problem, every dataset and every optimization target are different. A smart choice of validation set is important.
If the data is time dependent, the training validation split should also be time dependent, or the local score will be not reliable. If the data size is very large, carefully sampling a smaller validation set is also important so you can try and test new ideas efficiently.
Machine’s Return to Machine, Human’s Return to Human
Proficiency in existing tools and homemade code will largely reduce a Data Scientist’s time spent on repetitive and monotonous work. Therefore, time will be saved in order to think and to test creative ideas. Good software engineering skills are highly beneficial to Data Scientists’ work.
Understanding the Algorithms
Thanks to the rapid development of machine learning tools like sklearn and XGBoost, a lot of popular and effective machine learning algorithms are already implemented with easy-to-use APIs. Model training and predicting may only take three lines of code. This makes the threshold of machine learning low.
However, in order to create a more robust and accurate model, the understanding of algorithms is vital. In this competition, building models with existing open-sourced library cannot guarantee a Top 10 finish.
An insightful understanding of Naïve Bayes and kernel density estimation boosts the performance of the model and places it in the Top 5 among 1212 competitors.

